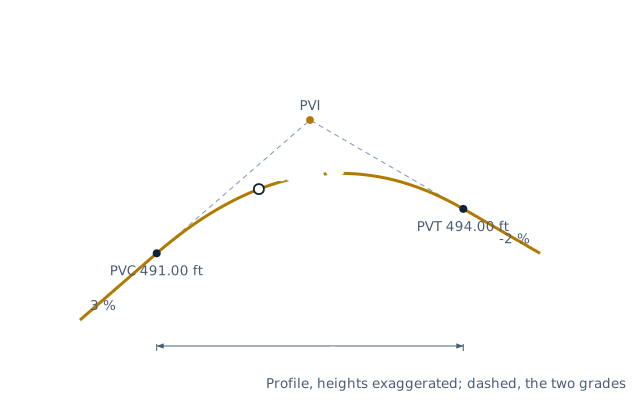
Drawn for the default inputs. It redraws as you change them.
Results are estimates. They do not replace the governing code, class or flag requirements, or a check by a competent person. Report a problem
Introduction
A vertical curve joins two road grades with a parabola so the change of slope is smooth. It starts at the PVC, bends about the PVI where the two grades meet, and ends at the PVT. The elevation at any point is the tangent elevation plus a parabolic offset. A 600 ft crest curve from a +3 % grade to a −2 % grade, with its PVI at 25+00 and elevation 500.00 ft, peaks at station 25+60 at 496.40 ft.
This calculator gives the PVC and PVT stations and elevations, the elevation and grade at any station, the high or low point and the K value. It also checks the stopping sight distance the curve provides against the AASHTO value for a design speed, and lists the elevations at regular stations. It is for highway and site engineers, surveyors setting out grades, and students of route design.
Formulas
Elevation at a distance x from the PVC on a curve of length L:
x_turn = −g1 L / (g2 − g1)
A = |g2 − g1| in %,    K = L / A
AASHTO sight distance S provided, in feet (metric constants in brackets):
crest, S < L:  L = A S² / 2158  [658]       S > L:  L = 2S − 2158/A  [658]
sag,   S < L:  L = A S² / (400 + 3.5 S)  [120 + 3.5 S]
stopping sight distance needed = 1.47 V t + 1.075 V²/a,  t = 2.5 s, a = 11.2 ft/s²
g1, g2 — grades in and out, as decimals in the elevation formula
Stations increase in the direction of travel; 25+60 means 2 560 ft
V — design speed in mph; the metric form is 0.278 V t + 0.039 V²/a with V in km/h and a = 3.4 m/s²
Assumptions and limitations
The curve is an equal-tangent parabola with half its length each side of the PVI. Unsymmetrical curves are not covered.
The crest check uses AASHTO's 3.5 ft eye height and 2.0 ft object. The sag check uses the headlight criterion, a 2.0 ft headlight with a 1° upward beam.
The stopping sight distance is for level ground. Steep downgrades need longer distances. Sag curves also get a warning when they are shorter than the comfort length A V²/46.5.
Elevations outside the curve are on the tangents.
Worked example
A crest curve joins a +3 % grade to a −2 % grade. The PVI is at station 25+00, elevation 500.00 ft, and the curve is 600 ft long. The design speed is 50 mph.
PVC: 25+00 − 300 = 22+00, at 500 − 0.03 × 300 = 491.00 ft. PVT: 28+00, at 500 − 0.02 × 300 = 494.00 ft.
At station 24+00, x = 200 ft: y = 491 + 0.03 × 200 − 0.05 × 200² / 1 200 = 495.33 ft.
High point: x = 0.03 × 600 / 0.05 = 360 ft, station 25+60, elevation 491 + 10.8 − 5.4 = 496.40 ft.
A = 5 %, so K = 600 / 5 = 120.0 ft.
Sight distance: 2158 / 5 = 431.6 ft is less than L, so S < L and S = √(600 × 2158 / 5) = 508.9 ft.
Needed at 50 mph: 1.47 × 50 × 2.5 + 1.075 × 50² / 11.2 = 423.7 ft. The curve is adequate.
The worked example, drawn by the same code as the live drawing above.
FAQ
What are PVC, PVI and PVT?
The point of vertical curvature where the curve starts, the point of vertical intersection where the two grades meet, and the point of vertical tangency where it ends.
What is the K value of a vertical curve?
The horizontal length needed for a 1 % change of grade, K = L / A. AASHTO tabulates minimum K values by design speed, for example 84 for a crest and 96 for a sag at 50 mph.
Why use a parabola instead of a circular arc?
A parabola changes grade at a constant rate per station. Its offsets from the tangent are easy to compute and set out.
How do I find the high point of a crest curve?
It lies where the grade is zero, at x = −g1 L / (g2 − g1) from the PVC. It exists only when the grades have opposite signs.
What is the difference between crest and sag curves?
On a crest the grade decreases and sight distance is limited by the hill. On a sag the grade increases and, at night, by how far the headlights reach.
How is station 25+60 read?
25 full stations of 100 ft plus 60 ft, so 2 560 ft from the start of the project. Metric stations count kilometres, such as 1+250.000.
Related calculators
Slope calculator — grade between two points in percent and degrees.
Before every release the calculator must reproduce each case below. The note under each case says where the expected answer comes from: a standard, a textbook, a published table, or a hand calculation shown in full.
Crest +3 % / −2 %, L 600 ft, PVI 25+00 at 500.00 ft: PVC 22+00 at 491.00, PVT 28+00 at 494.00, 495.33 ft at 24+00, high point 25+60 at 496.40 ftHand calculation: y = y_PVC + g1 x + (g2 − g1) x²/(2L); x_high = −g1 L/(g2 − g1) = 360 ft (Ghilani & Wolf, Vertical Curves)
Middle ordinate at the PVI is A L / 800 = 5 × 600 / 800 = 3.75 ft; outside the curve the tangent applies; the grade is zero at the high pointProperty of the equal-tangent parabola: e = (g2 − g1) L / 8
AASHTO stopping sight distance: 423.7 ft at 50 mph (design 425), 566.0 ft at 60 mph (570), 129.0 m at 80 km/h (130)AASHTO Green Book 2018, section 3.2.2 and Table 3-1: SSD = 1.47 V t + 1.075 V²/a, t = 2.5 s, a = 11.2 ft/s²
AASHTO design K: crest 84 (50 mph, S 425 ft), 151 (60 mph, 570 ft), 26 (80 km/h, 130 m); sag 96 (50 mph) and 30 (80 km/h)AASHTO Green Book 2018, section 3.4.6 design controls for crest and sag vertical curves (K = L/A rounded up, from L = A S²/2158 or A S²/(400 + 3.5 S))
Stations print as 25+60.00 and 1+250.000; equal grades, a negative PVC station and too fine a table interval are refusedBehaviour check: warnings and rejected inputs
Worked example of the article: the calculator reproduces 491.00 ft, 494.00 ft, 495.33 ft, 496.40 ft, 120.0 ft, 508.9 ft, 423.7 ft to the digits printedThe worked example on this page, to the digits printed
Assumptions and sources
Assumptions and limits
The curve is a symmetrical parabola, half its length on each side of the PVI, with stations measured horizontally. Unsymmetrical curves need two parabolas and are not covered.
Grades are in percent, positive uphill in the direction of increasing stations.
Sight distance uses the AASHTO Green Book formulas: on crests a 3.5 ft (1.08 m) eye height and a 2.0 ft (0.60 m) object; on sags the headlight criterion with a 2.0 ft (0.60 m) headlight and a 1° upward beam.
The stopping sight distance needed for a design speed uses a 2.5 s reaction time and 11.2 ft/s² (3.4 m/s²) deceleration on level ground; grade corrections and comfort or appearance criteria for sags are not included.
Stations before the PVC or after the PVT take the elevation of the tangent. On sag curves the AASHTO comfort length A V²/46.5 (A V²/395 in metric) is checked as a warning.
Sources
AASHTO, A Policy on Geometric Design of Highways and Streets, 7th ed. (2018), section 3.2.2 Stopping Sight Distance and section 3.4.6 Vertical Curves (crest and sag length formulas, K = L/A)
Ghilani, C.D. and Wolf, P.R., Elementary Surveying: An Introduction to Geomatics, 13th ed., ch. 25 Vertical Curves (equal-tangent parabolic curves, high and low points)
Cite this calculator
Papandreou, C. (2026). Vertical curve calculator (crest and sag). Engineering Bible. https://engineeringbible.com/civil/vertical-curve/
Embed this calculator on your site
Copy this HTML into your page. The calculator stays free to use and links back here.