Payback year, 25-year savings, ROI, NPV and IRR of a solar PV system from cost, incentives, production, self-consumption, tariffs, price rises and degradation.
Drawn for the default inputs. It redraws as you change them.
Results are estimates. They do not replace the governing code, class or flag requirements, or a check by a competent person. Report a problem
Introduction
How long do solar panels take to pay for themselves? Divide the net cost by the yearly saving. The saving is the energy you use yourself at the price you would have paid, plus the energy you export at the export price. A 6 kW system costing 15 000 that saves 1 287 in its first year pays back in 11.7 years on that simple measure. Rising electricity prices shorten this, and the slow decline of the panels lengthens it.
This calculator follows the savings year by year with price escalation and panel degradation. It gives the payback year, the savings and return over 25 years, the net present value at a discount rate, the internal rate of return and the levelised cost of the energy. It is for homeowners, installers and small businesses comparing a solar quote with its alternatives.
payback: the year in which Σ S_n reaches C_net
NPV = −C_net + Σ S_n / (1 + r)^n
ROI = (Σ S_n − C_net) / C_net
LCOE = (C_net + Σ O&M / (1 + r)^n) / Σ E_n / (1 + r)^n
C_net — installed cost less tax credits, rebates and grants
P_kW — system size; Y — specific yield in kWh per kW per year
d — degradation per year; e — electricity price rise per year
s — share of the production used on site; p_imp, p_exp — import and export prices
r — discount rate; the IRR is the rate at which the NPV is zero
Assumptions and limitations
Both prices rise by the same rate each year. The running cost stays flat.
The default degradation is 0.5 % a year, the median that Jordan and Kurtz found in their 2013 review of field data.
The self-consumption share depends on when you use electricity. A battery, an electric car or a heat pump raises it.
Inverter replacement, financing and taxes are not included unless you enter them as a yearly running cost.
The specific yield depends on the site, tilt and shading. PVWatts or PVGIS gives it for your address.
Worked example
A 6 kW system costs 15 000 with no incentives. The site yields 1 300 kWh per kW per year. Half the energy is used at home, saving 0.25 per kWh, and half is exported at 0.08. Prices rise 3 % a year, the panels lose 0.5 % a year, and money is discounted at 4 %. What is the payback over 25 years?
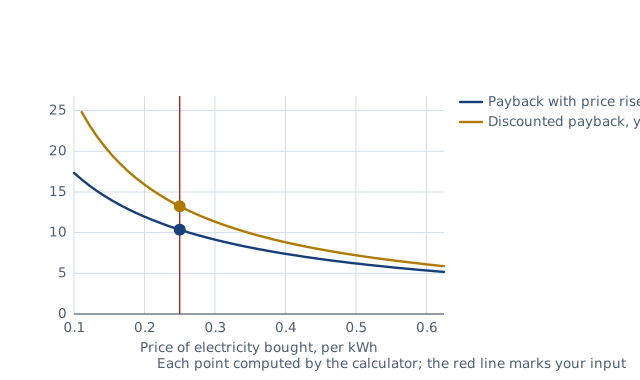
With price rises and degradation, the cumulative saving reaches 15 000 after 10.4 years.
Total savings over 25 years: 43 876, a net gain of 28 876 and a return of 193 %.
Net present value at 4 %: 11 088. The internal rate of return is 9.4 %.
Discounted at 4 %, the payback stretches to 13.2 years. The energy costs 0.129 per kWh over the life, about half the import price.
The worked example, drawn by the same code as the live drawing above.
FAQ
How do I calculate solar panel payback?
Divide the net cost after incentives by the first-year saving for the simple payback. Price rises shorten it and degradation lengthens it.
What is a good payback period for solar panels?
Shorter than the life of the system by a wide margin. Panels are usually warranted for about 25 years, so a payback of 10 years leaves 15 years of savings.
Does self-consumption matter?
Yes, when the export price is below the import price. In the example, raising self-consumption from 50 to 100 % raises the first-year saving from 1 287 to 1 950.
How much do solar panels degrade per year?
About 0.5 % a year at the median, from Jordan and Kurtz's review of field measurements. After 25 years a panel still makes about 89 % of its first-year output.
What is the difference between ROI and NPV?
ROI compares the total savings with the cost, without regard to when they arrive. NPV discounts each year's saving to today, so it shows whether solar beats investing the money at the discount rate.
What is the levelised cost of solar energy?
The cost of each kWh produced over the life, with the cost and the energy both discounted. In the example it is 0.129 per kWh.
Before every release the calculator must reproduce each case below. The note under each case says where the expected answer comes from: a standard, a textbook, a published table, or a hand calculation shown in full.
6 kW × 1 300 kWh/kW, half self-used at 0.25, half exported at 0.08: 7 800 kWh, 1 287 in year 1, simple payback 11.66 yearsHand calculation: S_1 = E_1 [s p_imp + (1 − s) p_exp]
3 % price rises and 0.5 % degradation: 25-year savings 1 287 × (g²⁵ − 1)/(g − 1) = 43 876 with g = 0.995 × 1.03; NPV at 4 % 11 088; payback 10.36 yearsClosed-form geometric series of the yearly savings (Short, Packey and Holt, NREL TP-462-5173, present value of a geometric gradient)
No price rise and no degradation: the payback equals the simple payback, NPV at 0 % equals the net gain, LCOE = cost / lifetime kWhLimiting cases of the definitions
The IRR makes the NPV zero: at a discount rate equal to the IRR the NPV vanishesDefinition of the internal rate of return
A 30 % tax credit and a 1 000 grant on 15 000 leave 9 500; entered production of 7 800 kWh matches 6 kW × 1 300Hand calculation: 15 000 × 0.7 − 1 000
A system that never pays back gives no payback year and warns; incentives above the cost and a fractional period are rejectedBehaviour check: warnings and rejected inputs
Worked example of the article: the calculator reproduces 7 800 kWh, 1 287, 11.66, 10.4, 43 876, 11 088 to the digits printedThe worked example on this page, to the digits printed
Assumptions and sources
Assumptions and limits
The saving in each year is the energy you use yourself valued at the import price plus the energy you export valued at the export price, less any yearly running cost; both prices rise by the escalation rate each year and the running cost stays flat.
Production falls by the degradation rate each year; 0.5 % a year is the median rate Jordan and Kurtz found in their review of about 2 000 field measurements (NREL, 2013).
The self-consumption share is the part of the production used on site at the moment it is produced; it depends on when the home uses electricity, and a battery, an EV or a heat pump raises it.
Simple payback is the net cost divided by the first-year saving; the payback year adds price escalation and degradation; the discounted figures and the NPV use the discount rate, following the NREL manual of Short, Packey and Holt (1995).
Inverter replacement (often once in 25 years), insurance, financing costs and taxes on the saving are not included unless entered as the yearly running cost.
Sources
Short, W., Packey, D. J. and Holt, T., A Manual for the Economic Evaluation of Energy Efficiency and Renewable Energy Technologies, NREL/TP-462-5173, 1995 (payback, NPV, IRR, levelised cost of energy)
Jordan, D. C. and Kurtz, S. R., Photovoltaic Degradation Rates — An Analytical Review, Progress in Photovoltaics 21 (2013) 12–29 (median degradation 0.5 % per year)
NREL PVWatts Calculator technical manual (specific yield, kWh per kW per year, for a site)
Cite this calculator
Papandreou, C. (2026). Solar panel payback calculator. Engineering Bible. https://engineeringbible.com/energy/solar-payback/
Embed this calculator on your site
Copy this HTML into your page. The calculator stays free to use and links back here.