Introduction
How long does an electric car take to charge? Work out the energy the battery needs, add the charging losses, and divide by the charging power. Charging a 75 kWh battery from 20 to 80 % puts 45 kWh into it. At 90 % efficiency, a 7.2 kW home charger draws 50 kWh from the grid and takes just under 7 hours.
This calculator gives the charging time, the energy drawn and lost, the cost at your electricity price, and the range added in total and per hour of charging. It handles Level 1 and Level 2 AC charging, limited by the car's onboard charger, and DC fast charging, limited by the car's maximum DC power. It is for EV drivers, fleet managers and anyone planning home or workplace charging.
Formulas
Energy, time and cost:
E_bat = C × (SoC_end − SoC_start)
E_grid = E_bat / η
P = min(P_charger, P_car)
t = E_grid / P
cost = E_grid × price
Range:
range = E_bat / c
range per hour = P × η / c- C — usable battery capacity; SoC — state of charge
- η — charging efficiency from the grid to the battery
- P_charger — charger power, volts × amps for AC
- P_car — onboard charger limit (AC) or maximum DC charging power
- c — consumption from the battery, in kWh per mile or per km
Assumptions and limitations
- The power is constant during the charge. DC fast charging slows down sharply above about 80 %, so a charge to 100 % takes longer than shown.
- The efficiency covers the onboard charger, cables, battery and cooling. Idaho National Laboratory measured 88.8 % on Level 1 and 90.8 % on Level 2 for one car's onboard charger. Plan with 85 to 90 %, and less in cold weather.
- The consumption is what the trip computer shows, taken from the battery. EPA label figures in kWh/100 mi are measured at the wall and already include the charging losses.
- The price is per kWh from the grid or the charging station. Standing charges, session fees and time-of-use rates are not included.
Worked example
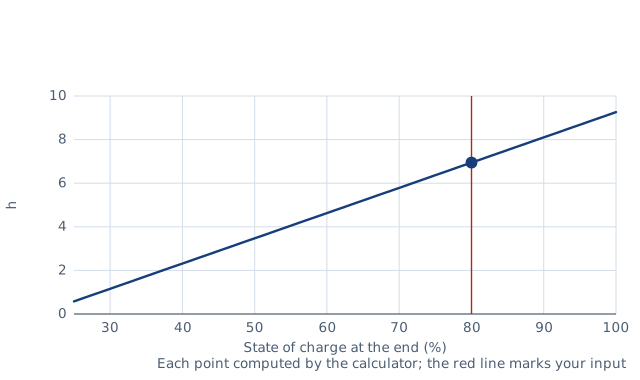
A car with a 75 kWh usable battery charges from 20 to 80 % on a 7.2 kW Level 2 charger, 240 V at 30 A. Its onboard charger accepts 11 kW. The efficiency is 90 %, electricity costs 0.15 per kWh, and the car drives 3.4 mi/kWh. How long does it take, and what does it cost?
- Energy into the battery: 75 × (0.80 − 0.20) = 45.0 kWh.
- Energy from the grid: 45.0 / 0.90 = 50.0 kWh, so 5 kWh is lost.
- Power: the charger's 7.2 kW is below the car's 11 kW, so 7.2 kW.
- Time: 50.0 / 7.2 = 6.94 h, or 6 h 57 min.
- Cost: 50.0 × 0.15 = 7.50.
- Range added: 45.0 × 3.4 = 153 mi.
- Range added per hour of charging: 7.2 × 0.90 × 3.4 = 22.0 mph, that is 22 miles for each hour on the charger.
Common cases
A 75 kWh usable battery charged from 20 to 80 %, at 90 % efficiency, by a car with an 11 kW onboard charger and a 150 kW DC limit, driving 3.4 mi/kWh. The power is the lower of the charger and the car; DC times assume the full power holds to 80 %, and most sessions average less.
| Case | Charger (kW) | Charging at (kW) | Time | Range per hour (mph) |
|---|---|---|---|---|
| Level 1, 120 V × 12 A | 1.44 | 1.44 | 34 h 43 min | 4.4064 |
| Level 2, 240 V × 16 A | 3.84 | 3.84 | 13 h 1 min | 11.75 |
| Level 2, 240 V × 30 A | 7.2 | 7.2 | 6 h 57 min | 22.032 |
| Level 2, 240 V × 40 A | 9.6 | 9.6 | 5 h 13 min | 29.376 |
| Three-phase wallbox, 11 kW | 11.04 | 11 | 4 h 33 min | 33.66 |
| Three-phase AC post, 22 kW | 22 | 11 | 4 h 33 min | 33.66 |
| DC fast charger, 50 kW | 50 | 50 | 1 h 0 min | 153 |
| DC fast charger, 150 kW | 150 | 150 | 20 min | 459 |
| DC fast charger, 350 kW | 350 | 150 | 20 min | 459 |
Every row is worked out by this calculator each time the site is built, and checked for impossible values. Open a case to load its inputs.
Common mistakes
- Expecting the wallbox rating on AC. The car's onboard charger sets the limit. An 11 kW wallbox charging a car with a 7.4 kW onboard charger runs at 7.4 kW, so 20 to 80 % of a 75 kWh battery takes 6 h 45 min, not the 4 h 33 min a car that accepts 11 kW would need.
- Leaving out the charging losses. The meter counts the losses too. At 90 % efficiency, 45 kWh into the battery draws 50 kWh and costs 7.50 at 0.15 per kWh, not 6.75, and takes 6 h 57 min at 7.2 kW instead of 6 h 15 min.
- Counting the losses twice with label figures. EPA figures in kWh/100 mi are measured at the wall and already include the losses. With 30 kWh/100 mi and 90 % efficiency the cost works out at 0.050 per mile, against the correct 0.045 at 100 %, so set the efficiency to 100 % for such figures.
- Assuming DC fast charging holds its power to 100 %. The car cuts the current above about 80 %. The constant-power estimate for 20 to 100 % at 150 kW is 27 minutes, and the calculator warns that the real charge takes much longer.
- Using the gross battery capacity. Part of the battery is kept in reserve and never used. Enter the usable capacity, which is the figure that the state of charge on the dashboard refers to.
FAQ
How long does it take to charge an electric car?
Divide the energy needed, including losses, by the charging power. A 50 kWh charge takes about 7 hours at 7.2 kW and about 35 hours at 1.44 kW.
What is the difference between Level 1 and Level 2 charging?
Level 1 uses a 120 V household outlet at 12 to 16 A, 1.4 to 1.9 kW. Level 2 uses 208 to 240 V at up to 80 A, up to 19.2 kW, and most home units deliver up to 7.2 kW.
How much does it cost to charge an EV?
Multiply the energy drawn from the grid by the price per kWh. 50 kWh at 0.15 costs 7.50.
Why does my car charge slower than the charger's rating?
The car's onboard charger limits AC charging. An 11 kW wallbox charges a car with a 7.4 kW onboard charger at only 7.4 kW.
Why does DC fast charging slow down above 80 %?
The car reduces the current as the battery fills, to protect the cells. Each kWh near the top therefore takes much longer to add.
How efficient is EV charging?
Typically 85 to 90 % from the wall to the battery. The losses heat the charger, the cables and the battery.
How many miles of range does an hour of charging add?
Charging power × efficiency × miles per kWh. At 7.2 kW, 90 % and 3.4 mi/kWh it is 22 miles per hour.
Related calculators
- Electricity cost and energy use — the running cost of any load.
- Battery charge time — charge time for any battery in Ah.
- kW to amps — the circuit current of a charger.
- Solar panel payback calculator — charging from your own panels.