Wind turbine power from rotor diameter, wind speed, air density and power coefficient (Betz limit), and yearly energy from the mean wind speed by Rayleigh.
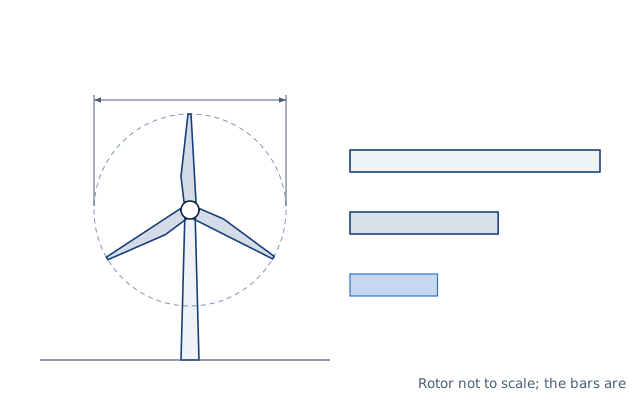
Drawn for the default inputs. It redraws as you change them.
Results are estimates. They do not replace the governing code, class or flag requirements, or a check by a competent person. Report a problem
Introduction
How much power does a wind turbine make? The wind carries ½ ρ A v³ through the rotor's swept area, and the turbine converts a fraction Cp of it. A 3 m rotor in a 6 m/s wind meets 935 W of wind power. At a power coefficient of 0.35 it delivers 327 W. Because power rises with the cube of the speed, a 10 % stronger wind gives 33 % more power.
This calculator gives the power at any wind speed, the Betz limit and the rated power. It estimates the yearly energy from the site's mean wind speed with a Rayleigh distribution and the turbine's cut-in, rated and cut-out speeds, or from a capacity factor. Air density follows from the altitude. It is for homeowners, farmers, students and engineers making a first estimate before a site survey.
Formulas
Power and the Betz limit:
P = ½ ρ A v³ Cp,    A = π D² / 4
Cp ≤ 16/27 = 0.593
Rayleigh distribution of the wind speed, mean v̄:
f(v) = (π v / (2 v̄²)) exp(−π v² / (4 v̄²))
P_mean = ∫ P(v) f(v) dv,    E = 8 760 h × P_mean
Idealised power curve and density:
P(v) = 0 below v_in and above v_out;  ½ ρ A v³ Cp up to v_r;  P_r = ½ ρ A v_r³ Cp from v_r to v_out
ρ = p(h) / (R T),  ISO 2533 standard atmosphere
ρ — air density, 1.225 kg/m³ at sea level and 15 °C
D — rotor diameter; v — wind speed; Cp — power coefficient from wind to electricity
v_in, v_r, v_out — cut-in, rated and cut-out speeds
capacity factor = P_mean / P_r
Assumptions and limitations
Cp is constant between cut-in and rated speed. Real power curves are rounder, so use the manufacturer's curve where you have it.
Small turbines reach a Cp of about 0.25 to 0.35 from wind to electricity, large ones about 0.45 at their best. No turbine can exceed 0.593.
The mean wind speed must be at hub height. Wind speed rises with height, and trees and buildings slow it down.
The Rayleigh distribution suits many inland sites. Sites with steadier or gustier winds have a different Weibull shape factor.
Downtime, wake losses and cable losses are not deducted.
Worked example
A small turbine has a 3 m rotor, a power coefficient of 0.35 and a rated speed of 11 m/s. It cuts in at 3 m/s and out at 25 m/s. The site is at sea level with a mean wind speed of 5 m/s at hub height. What does it produce?
Swept area: π × 3² / 4 = 7.07 m².
Power at 6 m/s: 0.5 × 1.225 × 7.07 × 6³ × 0.35 = 327 W.
Rated power at 11 m/s: 0.5 × 1.225 × 7.07 × 11³ × 0.35 = 2 017 W.
Averaged over the Rayleigh distribution for 5 m/s, the mean power is 338 W.
Energy per year: 338 × 8 760 = 2 962 kWh.
Capacity factor: 338 / 2 017 = 16.8 %.
The turbine turns between cut-in and cut-out for 75 % of the year.
The worked example, drawn by the same code as the live drawing above.
FAQ
How do you calculate wind turbine power?
Multiply half the air density by the swept area, the cube of the wind speed and the power coefficient. At 1.225 kg/m³ and 10 m/s the wind carries 612.5 W per square metre.
What is the Betz limit?
The highest share of the wind's power any rotor can extract, 16/27 or 59.3 %. Albert Betz derived it from the momentum of the air passing the rotor.
Why does wind speed matter so much?
Power rises with the cube of the speed. Doubling the wind speed gives eight times the power, so a good site matters more than a bigger turbine.
Can I use the mean wind speed in the power formula?
No. The faster winds carry most of the energy. For a Rayleigh distribution the mean power in the wind is 1.91 times the power at the mean speed.
What is a capacity factor?
The average output divided by the rated power. The 3 m turbine of the worked example reaches 16.8 % on a 5 m/s site.
How does altitude affect wind power?
Thinner air carries less power. At 1 000 m the standard density is 1.112 kg/m³, about 9 % less than at sea level.
Before every release the calculator must reproduce each case below. The note under each case says where the expected answer comes from: a standard, a textbook, a published table, or a hand calculation shown in full.
3 m rotor at 6 m/s, 1.225 kg/m³, Cp 0.35: A = 7.069 m², 327.3 W; rated 2 017 W at 11 m/sHand calculation: P = ½ ρ A v³ Cp
Wind power density at 10 m/s and 1.225 kg/m³ is 612.5 W/m²; the Betz limit is 16/27 of it, 363.0 W/m²Manwell, McGowan and Rogers, Wind Energy Explained, 2nd ed., ch. 2 (P/A = ½ ρ v³) and ch. 3 (Cp,max = 16/27)
ISO 2533 standard atmosphere: 1.2250 kg/m³ at sea level, 1.1117 at 1 000 m, 1.0066 at 2 000 mISO 2533:1975 Standard Atmosphere, tabulated density
Rayleigh: the mean of v³ is (6/π) v̄³ (energy pattern factor 1.91); P(v > v̄) = exp(−π/4) = 0.456Manwell, McGowan and Rogers, Wind Energy Explained, 2nd ed., ch. 2 (Rayleigh distribution)
Default turbine on a 5 m/s Rayleigh site: 338 W mean, 2 962 kWh a year, capacity factor 16.8 %, running 75.4 % of the yearNumerical integration of the idealised power curve (Simpson, checked against the analytical moment above)
Capacity factor mode: energy = rated power × CF × 8 760 hDefinition of the capacity factor
A power coefficient above the Betz limit, a cut-in at or above the rated speed and a cut-out below it are rejectedBehaviour check: warnings and rejected inputs
Worked example of the article: the calculator reproduces 7.07 m², 327 W, 2 017 W, 338 W, 2 962 kWh, 16.8 % to the digits printedThe worked example on this page, to the digits printed
Assumptions and sources
Assumptions and limits
The power is ½ ρ A v³ Cp: the kinetic energy flux through the swept area times the power coefficient. No turbine can exceed the Betz limit Cp = 16/27 = 0.593; small turbines reach about 0.25 to 0.35 from wind to electricity, large ones about 0.45 at their best.
Air density comes from the ISO 2533 standard atmosphere at the hub altitude, optionally with the actual air temperature at the standard pressure of that altitude; humidity is neglected (it lowers the density by under 1 %).
The yearly energy uses an idealised power curve: zero below the cut-in speed, P = ½ ρ A v³ Cp with a constant Cp up to the rated speed, the rated power up to the cut-out speed, and zero above it. A real power curve from the manufacturer gives a better estimate.
Wind speeds follow a Rayleigh distribution (Weibull with k = 2) about the mean speed at hub height, as in the IEC 61400-12-1 annual energy estimate; sites with steadier or gustier winds have other shape factors. The mean speed must be at hub height: wind speed rises with height above the ground.
Availability, wake and electrical losses beyond those in Cp are not deducted; the year has 8 760 hours.
Sources
Manwell, McGowan and Rogers, Wind Energy Explained: Theory, Design and Application, 2nd ed., Wiley 2009: ch. 2 (wind power density, Rayleigh distribution) and ch. 3 (Betz limit 16/27)
IEC 61400-12-1:2017 Wind energy generation systems — Power performance measurements of electricity producing wind turbines (annual energy production from a power curve and a Rayleigh wind speed distribution)
ISO 2533:1975 Standard Atmosphere (ρ0 = 1.225 kg/m³, lapse rate 6.5 K/km)
Cite this calculator
Papandreou, C. (2026). Wind turbine power calculator. Engineering Bible. https://engineeringbible.com/energy/wind-turbine-power/
Embed this calculator on your site
Copy this HTML into your page. The calculator stays free to use and links back here.