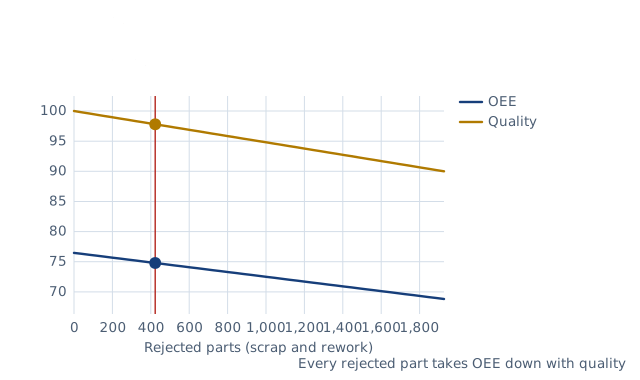
Drawn for the default inputs. It redraws as you change them.
Results are estimates. They do not replace the governing code, class or flag requirements, or a check by a competent person. Report a problem
Introduction
Overall equipment effectiveness (OEE) is the share of planned time in which a machine makes good parts at full speed. It is the product of three ratios: availability, performance and quality. A line that runs 88.81 % of its planned time, at 86.11 % of its ideal speed, with 97.80 % good parts, has an OEE of 74.79 %. Takt time is the pace demand sets: the available time divided by the number of parts the customer needs.
This calculator gives availability, performance, quality and OEE from shift length, stops, downtime, ideal cycle time and part counts. It also gives the takt time for a demand and checks whether the line keeps up with it. It is for production engineers, supervisors and continuous improvement teams.
Formulas
Times:
planned production time = shift − planned stops
run time = planned production time − downtime
OEE:
availability A = run time / planned production time
performance P = ideal cycle time × total count / run time
quality Q = good count / total count
OEE = A × P × Q = ideal cycle time × good count / planned production time
Takt time:
takt = planned production time / demand
Planned stops: breaks, meals and planned maintenance
Downtime: breakdowns, changeovers and other unplanned stops
Ideal cycle time: the fastest cycle the machine can sustain
Assumptions and limitations
Planned stops are taken out of the time before OEE is measured. A related measure, TEEP, counts all calendar time instead and gives a lower figure.
Performance needs a true ideal cycle time. If it is set too slow, performance goes above 100 % and OEE looks better than it is.
Quality counts parts good the first time. Reworked parts count as rejects.
Takt uses the same planned time as OEE. The line meets demand when its planned time per good part is at or below takt.
OEE does not show why time is lost. The loss categories behind each ratio point to the fixes.
Worked example
This is the example of OEE.com. A shift is 480 min with two 15 min breaks and a 30 min meal. The line was down for 47 min. The ideal cycle time is 1.0 s. It made 19 271 parts, of which 423 were rejected. The customer needs 18 000 parts a shift.
Planned production time: 480 − 60 = 420 min. Run time: 420 − 47 = 373 min.
Availability: 373 / 420 = 88.81 %.
Performance: 1.0 × 19 271 / (373 × 60) = 86.11 %.
Quality: 18 848 / 19 271 = 97.80 %.
OEE: 0.8881 × 0.8611 × 0.9780 = 74.79 %.
Takt: 420 × 60 / 18 000 = 1.40 s.
The line needs 25 200 / 18 848 = 1.337 s of planned time per good part, which is within takt.
The worked example, drawn by the same code as the live drawing above.
FAQ
What is a good OEE?
85 % is often quoted as world class. OEE.com notes that most manufacturers score closer to 60 %, and scores below 45 % are more common than scores above 85 %.
What is the difference between takt time and cycle time?
Takt is the pace the customer demand sets. Cycle time is how long the process takes per part. The cycle time must be at or below takt.
How do I calculate takt time?
Divide the available working time by the demand for the same period. 420 minutes for 18 000 parts is 1.4 s per part.
Why can performance exceed 100 %?
Only if the ideal cycle time is set slower than the machine really runs. Use the nameplate rate or the best cycle time ever sustained.
What is the quickest way to raise OEE?
Find the largest loss. Long changeovers and breakdowns lower availability, small stops and slow cycles lower performance, and scrap lowers quality.
Should breaks count as downtime?
Not for OEE. Planned stops are removed from the planned production time first. Counting them anyway is a different measure.
Before every release the calculator must reproduce each case below. The note under each case says where the expected answer comes from: a standard, a textbook, a published table, or a hand calculation shown in full.
Simple OEE identity: OEE = ideal cycle × good parts / planned time = 1.0 × 18 848 / 25 200 sOEE.com simple calculation (fully productive time ÷ planned production time)
Takt: 420 min for 18 000 parts is 1.40 s; 1.337 s per good part meets it; at 20 000 parts (1.26 s) it falls shortTakt time = available time / demand (hand calculation)
Limiting cases: no downtime, ideal speed and no rejects give OEE 100 %; a too-slow ideal cycle warns (performance above 100 %)Definitions (limiting cases)
Breaks longer than the shift, downtime longer than planned time and more rejects than parts are rejectedBehaviour check: warnings and rejected inputs
Worked example of the article: the calculator reproduces 88.81 %, 86.11 %, 97.80 %, 74.79 %, 1.40 s to the digits printedThe worked example on this page, to the digits printed
Assumptions and sources
Assumptions and limits
Planned production time is the shift minus planned stops (breaks, meals, planned maintenance); downtime is every unplanned stop and changeover inside it.
Performance compares the ideal (fastest sustainable) cycle time with the run time; a value above 100 % means the ideal cycle time is set too slow.
Quality counts only parts good the first time; reworked parts count as rejects.
Takt time is the planned production time divided by the customer demand for the same period; a line meets demand when its planned time per good part is at or below takt.
Sources
Vorne Industries, OEE.com, Calculate OEE: definitions and worked example (availability 88.81 %, performance 86.11 %, quality 97.80 %, OEE 74.79 %)
ISO 22400-2:2014 Automation systems and integration — Key performance indicators for manufacturing operations management, Part 2: OEE index = availability × effectiveness × quality ratio
Nakajima, S., Introduction to TPM: Total Productive Maintenance, Productivity Press, 1988 (the six big losses and OEE)
Cite this calculator
Papandreou, C. (2026). OEE and takt time calculator. Engineering Bible. https://engineeringbible.com/manufacturing/oee/
Embed this calculator on your site
Copy this HTML into your page. The calculator stays free to use and links back here.