Introduction
The compressibility factor Z measures how far a real gas departs from the ideal gas law. It is defined by P V = Z n R T, so Z = 1 for an ideal gas. At high pressure the molecules attract each other and Z falls below 1, so the gas is denser than PV = nRT predicts. A typical natural gas at 70 bar and 15 °C has Z = 0.85 and is 18 % denser than an ideal gas.
This calculator finds Z in two ways. For natural gas it estimates the pseudo-critical properties from the gas specific gravity, corrects them for H₂S and CO₂, and solves the Dranchuk–Abou-Kassem fit of the Standing–Katz chart. For a pure gas it uses the Pitzer correlation from the critical temperature, critical pressure and acentric factor. It gives the density and the gas formation volume factor too. It is for gas pipeline, reservoir and process engineers.
Formulas
Natural gas: Sutton (1985) pseudo-critical properties from the specific gravity γ:
Tpc = 169.2 + 349.5 γ − 74.0 γ²      °R
ppc = 756.8 − 131.0 γ − 3.6 γ²       psia
Wichert–Aziz correction for acid gas, with A = y_H₂S + y_CO₂ and B = y_H₂S:
ε = 120 (A^0.9 − A^1.6) + 15 (B^0.5 − B^4)      °R
T′pc = Tpc − ε,   p′pc = ppc T′pc / (Tpc + B (1 − B) ε)
Dranchuk–Abou-Kassem, solved for Z at Tpr = T / Tpc and ppr = p / ppc:
Z = 1 + (A1 + A2/Tpr + A3/Tpr³ + A4/Tpr⁴ + A5/Tpr⁵) ρr + (A6 + A7/Tpr + A8/Tpr²) ρr²
    − A9 (A7/Tpr + A8/Tpr²) ρr⁵ + A10 (1 + A11 ρr²) (ρr² / Tpr³) exp(−A11 ρr²)
ρr = 0.27 ppr / (Z Tpr)
Pure gas, Pitzer correlation with the Abbott coefficients:
Z = 1 + (B⁰ + ω B¹) Pr / Tr
B⁰ = 0.083 − 0.422 / Tr^1.6,   B¹ = 0.139 − 0.172 / Tr^4.2
Density and formation volume factor:
ρ = P M / (Z R T), Bg = (p_sc / T_sc) × Z T / p- A1 to A11 — 0.3265, −1.0700, −0.5339, 0.01569, −0.05165, 0.5475, −0.7361, 0.1844, 0.1056, 0.6134, 0.7210
- ω — acentric factor; Tr, Pr — reduced temperature and pressure of the pure gas
- M — molar mass, 28.964 γ for natural gas; p_sc, T_sc — 14.696 psia and 60 °F
Assumptions and limitations
- The Standing–Katz chart and its fit cover reduced temperatures from 1.05 to 3 and reduced pressures up to 30. The calculator refuses conditions outside them.
- Sutton's correlation was fitted to gases of specific gravity 0.57 to 1.68. Gases with much nitrogen or water vapour need a composition-based method.
- Near Tpr = 1.05 to 1.2 and ppr = 1 to 2.5 the chart is steep, and Z is least accurate there.
- The Pitzer virial correlation holds only at low density. The calculator stops when the molar volume falls below twice the critical volume.
- Pressure and temperature are absolute, and the gas must be above its dew point.
Worked example
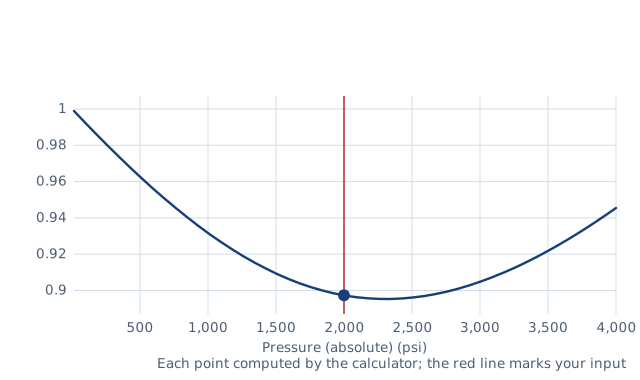
A natural gas of specific gravity 0.65, free of H₂S and CO₂, is at 2 000 psia and 200 °F. What are its Z factor and density?
- Tpc = 169.2 + 349.5 × 0.65 − 74.0 × 0.65² = 365.1 °R.
- ppc = 756.8 − 131.0 × 0.65 − 3.6 × 0.65² = 670.1 psi (absolute).
- Tpr = (200 + 459.67) / 365.1 = 1.807 and ppr = 2 000 / 670.1 = 2.98.
- Solving the Dranchuk–Abou-Kassem equation gives Z = 0.897.
- Molar mass 28.964 × 0.65 = 18.83 g/mol, so ρ = 13.79 MPa × 18.83 / (0.897 × 8.314 × 366.5 K) = 94.95 kg/m³.
The ideal gas law would give 85.20 kg/m³, about 10 % too low.
Common cases
Z factor and density of natural gas by the calculator's natural-gas method, free of H₂S and CO₂ unless the row names them. Pressures are absolute. The density is what a meter or a line-pack estimate needs; the ideal gas law would give Z = 1.
| Case | Specific gravity | Pressure (absolute) (bar) | Temperature (°C) | Z factor | Density (kg/m³) |
|---|---|---|---|---|---|
| Distribution main, 10 bar | 0.6 | 10 | 15 | 0.9776 | 7.4203 |
| Regional pipeline, 40 bar | 0.6 | 40 | 15 | 0.9111 | 31.847 |
| Transmission pipeline, 70 bar | 0.6 | 70 | 15 | 0.8490 | 59.805 |
| Transmission pipeline, 100 bar | 0.6 | 100 | 15 | 0.7979 | 90.907 |
| Compressor discharge, 100 bar and 50 °C | 0.6 | 100 | 50 | 0.8719 | 74.18 |
| CNG cylinder, 200 bar | 0.6 | 200 | 15 | 0.7689 | 188.68 |
| Gas reservoir, 2 000 psia and 200 °F | 0.65 | 137.9 | 93.333 | 0.8974 | 94.946 |
| Deep reservoir, 5 000 psia and 250 °F | 0.7 | 344.74 | 121.11 | 1.0216 | 208.7 |
| Sour gas, 5 % H₂S and 10 % CO₂, 70 bar | 0.75 | 70 | 40 | 0.8569 | 68.157 |
Every row is worked out by this calculator each time the site is built, and checked for impossible values. Open a case to load its inputs.
Common mistakes
- Entering gauge pressure. The correlations need absolute pressure. A main at 10 bar gauge is at about 11 bar absolute: for a gas of specific gravity 0.6 at 15 °C that is 8.18 kg/m³, against 7.42 kg/m³ if the gauge reading is entered as absolute, about 9 % low.
- Using the ideal gas law at pipeline pressure. At 70 bar absolute and 15 °C the same gas has Z = 0.849. The ideal gas law gives 50.8 kg/m³ instead of 59.8 kg/m³, 15 % low, and line pack and meter readings come out wrong by the same amount.
- Leaving out the H₂S and CO₂. A sour gas of specific gravity 0.75 with 5 % H₂S and 10 % CO₂, at 70 bar and 40 °C, has Z = 0.857 with the acid-gas correction. Without it Z is 0.834 and the density 70.0 kg/m³ instead of 68.2 kg/m³, about 3 % high.
- Working out the reduced temperature in °C or °F. Tpr = T / Tpc only holds with both temperatures absolute, in kelvin or degrees Rankine. A gas of specific gravity 0.6 has Tpc = 195.7 K, so at 15 °C the reduced temperature is 288.15 / 195.7 = 1.472.
- Taking the specific gravity on the wrong basis. Gas specific gravity is the molar mass of the gas divided by that of air, 28.964 g/mol. A liquid specific gravity, or a density ratio measured at different pressures or temperatures, puts the pseudo-critical properties in the wrong place.
FAQ
What is the compressibility factor Z?
The ratio of the actual volume of a gas to the volume an ideal gas would occupy at the same pressure and temperature. Z = 1 means ideal behaviour.
What is a typical Z for natural gas?
For a gas of specific gravity 0.6 at 15 °C, Z is about 0.89 at 50 bar and 0.80 at 100 bar. At atmospheric pressure it is within 0.5 % of 1.
What is the Standing–Katz chart?
A chart from 1942 of Z against reduced pressure for natural gases, with one curve per reduced temperature. Equations such as Dranchuk–Abou-Kassem reproduce it to about 0.5 % on average.
Why correct for H₂S and CO₂?
Acid gases make the gas less ideal than its specific gravity suggests. Wichert and Aziz lower the pseudo-critical temperature and pressure to account for them.
What is the acentric factor?
A measure of how far a molecule departs from a simple sphere, defined from its vapour pressure at Tr = 0.7. It is about 0 for argon and methane, 0.2 for n-butane and 0.34 for water.
When can I ignore Z?
When it is within your accuracy needs of 1. For air and nitrogen near room temperature that holds up to about 20 bar. For natural gas and CO₂ it fails well before that.
Related calculators
- Mass flow rate — mass and standard flow with the real-gas density.
- Specific gravity — gas specific gravity from the molar mass.
- Ideal gas law — the Z = 1 limit.
- Vapour pressure — where a vapour condenses.