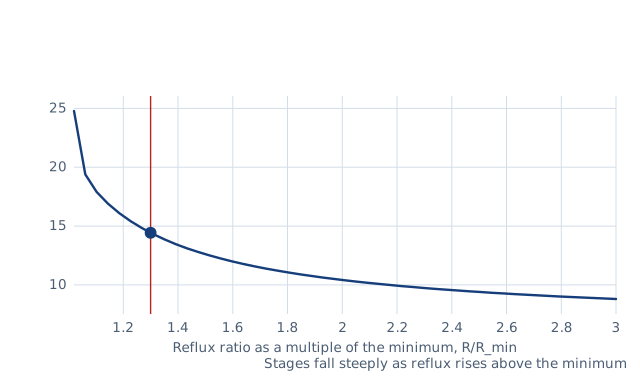
Minimum stages (Fenske), minimum reflux (Underwood), theoretical stages at a reflux ratio (Gilliland, Molokanov) and feed stage (Kirkbride) of a binary column.
Drawn for the default inputs. It redraws as you change them.
Results are estimates. They do not replace the governing code, class or flag requirements, or a check by a competent person. Report a problem
Introduction
How many stages does a distillation column need? The Fenske–Underwood–Gilliland shortcut answers in four steps: the minimum stages at total reflux, the minimum reflux ratio, the stages at the reflux you choose, and where to put the feed. Splitting a 50/50 mixture with a relative volatility of 2.5 into 95 % and 5 % products needs 14.4 theoretical stages at 1.3 times the minimum reflux.
This calculator applies the shortcut to a binary column. It uses the Fenske equation, the Underwood equations for any feed condition q, the Gilliland correlation in Molokanov's equation form and the Kirkbride feed-stage equation. It also gives the real tray count for an overall tray efficiency and the product rates. It is for chemical engineers and students making a first estimate before a rigorous simulation.
α — relative volatility of the light component to the heavy one
z, x_D, x_B — light-component mole fractions in the feed, distillate and bottoms
q — liquid fraction of the feed: 1 saturated liquid, 0 saturated vapour
R — reflux ratio L/D; N — theoretical stages including the reboiler
N_R, N_S — stages above and below the feed; B/D = (x_D − z) / (z − x_B)
Assumptions and limitations
The relative volatility is constant. Use the geometric mean of the top and bottom values. Strongly non-ideal mixtures and azeotropes need a stage-by-stage method.
Constant molar overflow is assumed: equal molar heats of vaporisation, so the liquid and vapour flows stay constant in each section.
Stages are theoretical and include a partial reboiler. A total condenser is not a stage. Real trays are (N − 1) divided by the tray efficiency.
The Gilliland correlation is a fit to many column designs. Wankat notes it is usually within 7 % but can be 30 % off, so check the design with a rigorous calculation.
Worked example
A benzene–toluene column takes a saturated liquid feed with 50 % benzene. The distillate must hold 95 % benzene and the bottoms 5 %. The average relative volatility is 2.5, and the reflux is 1.3 times the minimum.
Gilliland: X = (1.43 − 1.10) / 2.43 = 0.136, and the Molokanov equation gives Y = 0.518.
Stages: N = (6.43 + 0.518) / (1 − 0.518) = 14.4, including the reboiler.
Kirkbride: the split is symmetric, so N_R = N_S = 7.2. The feed goes onto stage 8 from the top.
With trays of 70 % efficiency, the column needs (14.4 − 1) / 0.7 = 19.2, so 20 real trays.
The worked example, drawn by the same code as the live drawing above.
FAQ
What is the Fenske–Underwood–Gilliland method?
A shortcut design for distillation. Fenske gives the minimum stages, Underwood the minimum reflux, and Gilliland's correlation links the two to the stages at the actual reflux.
What is relative volatility?
How much more readily the light component vaporises than the heavy one: α = (y/x) light ÷ (y/x) heavy. The larger it is, the fewer stages are needed.
What reflux ratio should I use?
Usually 1.1 to 1.5 times the minimum. Less reflux saves reboiler and condenser energy but needs more stages, and below about 1.05 the stage count rises steeply.
What is the feed condition q?
The fraction of the feed that joins the liquid flowing down the column. A saturated liquid has q = 1, a saturated vapour q = 0, and a subcooled liquid more than 1.
Why are the stages counted with the reboiler?
A partial reboiler makes vapour in equilibrium with the bottoms liquid, so it acts as one theoretical stage. The column itself needs one stage fewer.
How accurate is the shortcut method?
Good enough for screening and a first design. The Gilliland correlation is usually within 7 % of a rigorous calculation, but check the final design with a simulation.
Before every release the calculator must reproduce each case below. The note under each case says where the expected answer comes from: a standard, a textbook, a published table, or a hand calculation shown in full.
Fenske: benzene–toluene α = 2.4, x_D = 0.90, x_W = 0.10 needs n + 1 = 5.0 stages at total refluxAl-Mustaqbal University College, Mass transfer lecture (Fenske example: n + 1 = 5.0, 4 plates plus the reboiler)
Underwood for a saturated liquid feed equals the constant-α closed form [x_D/z − α(1 − x_D)/(1 − z)]/(α − 1) = 1.10Seader, Henley & Roper, Ch. 9 (Underwood); McCabe–Thiele pinch at the feed composition for constant α
Saturated vapour feed (q = 0): the pinch is at y = z, x = z/(α − (α − 1) z), so R_min = 2.10 for α = 2.5, z = 0.5, x_D = 0.95McCabe–Thiele construction with constant α (q-line horizontal through y = z); hand calculation
Molokanov: Y = 0 at X = 1 (infinite reflux gives N = N_min), Y → 1 as X → 0; X = 0.1358 gives Y = 0.5185, N = 14.42Molokanov et al. (1972), Int. Chem. Eng. 12, 209; Seader, Henley & Roper Ch. 9; hand calculation
More reflux means fewer stages; real trays are (N − 1)/E rounded up; impossible compositions are rejectedBehaviour check: warnings and rejected inputs
Worked example of the article: the calculator reproduces 6.43, 1.10, 1.43, 0.136, 0.518, 14.4, 7.2 to the digits printedThe worked example on this page, to the digits printed
Assumptions and sources
Assumptions and limits
The mixture is binary with a constant relative volatility α of the light component to the heavy one; use the geometric mean of the top and bottom values. Constant molar overflow is assumed, so the method suits ideal and near-ideal mixtures and not azeotropes.
Compositions are mole fractions of the light component: x_D in the distillate, x_B in the bottoms and z in the feed. The feed condition q is the fraction of the feed that is liquid: 1 for saturated liquid, 0 for saturated vapour, above 1 for subcooled liquid.
Stage counts are theoretical (equilibrium) stages including a partial reboiler, with a total condenser not counted. Real trays = (N − 1) divided by the overall tray efficiency, rounded up.
The Gilliland correlation (Molokanov form) is a fit to plate-to-plate results and is good for estimates: typically within about 7 % and occasionally 30 % (Wankat). Check the final design with a stage-by-stage or simulation calculation.
The Kirkbride equation places the feed so that the rectifying and stripping sections have N_R and N_S stages; the feed stage is the first stage below N_R, counted from the top.
Sources
J. D. Seader, E. J. Henley & D. K. Roper, Separation Process Principles, 3rd ed., Ch. 9 (Fenske eq., Underwood eqs., Gilliland correlation with the Molokanov equation, Kirkbride equation)
P. C. Wankat, Separation Process Engineering, 5th ed., Ch. 7 Approximate shortcut methods for multicomponent distillation (Fenske, Underwood, Gilliland; accuracy of the Gilliland correlation)
Y. K. Molokanov, T. P. Korablina, N. I. Mazurina & G. A. Nikiforov, An approximation method for calculating the basic parameters of multicomponent fractionation, Int. Chem. Eng. 12 (2), 209–212 (1972)
Cite this calculator
Papandreou, C. (2026). Distillation stages calculator (Fenske–Underwood–Gilliland). Engineering Bible. https://engineeringbible.com/process/distillation-stages/
Embed this calculator on your site
Copy this HTML into your page. The calculator stays free to use and links back here.