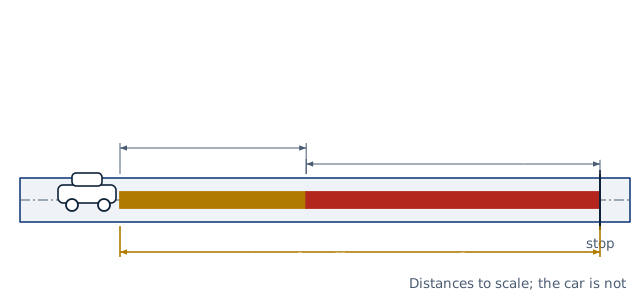
Drawn for the default inputs. It redraws as you change them.
Results are estimates. They do not replace the governing code, class or flag requirements, or a check by a competent person. Report a problem
Introduction
Stopping distance is the distance a vehicle covers from the moment a driver sees a hazard until it stops. It has two parts. The reaction distance is covered at full speed while the driver perceives and reacts. The braking distance follows, while the brakes slow the car. With the US highway design values of 2.5 s and 11.2 ft/s², a car at 60 mph needs about 570 ft to stop.
This calculator adds the reaction distance and the braking distance, in feet and metres. Braking uses either a deceleration rate, such as the AASHTO design value, or the tire-road friction of a surface from dry asphalt to ice. It allows for an uphill or downhill grade. It is for drivers, driving instructors, students and road designers.
Formulas
Stopping distance:
d = v × t + v² / (2 × (a + g G))
With a friction coefficient:
a = μ × g
AASHTO form in US units, V in mph:
SSD = 1.47 V t + V² / (30 × (a/32.2 + G)) ft
v — speed; t — perception-reaction time, 2.5 s in AASHTO design
a — deceleration on a level road, 3.4 m/s² (11.2 ft/s²) in AASHTO design
G — grade as a decimal, positive uphill
μ — tire-road friction coefficient; g = 9.81 m/s²
Average sliding friction coefficients (Wong):
Surface
μ
Asphalt or concrete, dry
0.75
Concrete, wet
0.70
Earth road, dry
0.65
Gravel
0.55
Asphalt, wet
0.45 to 0.60
Earth road, wet
0.40 to 0.50
Snow, hard-packed
0.15
Ice
0.07
Assumptions and limitations
The deceleration is constant from the end of the reaction time until the car stops. Brake build-up and air drag are ignored.
The AASHTO deceleration of 3.4 m/s² is a comfortable rate that most drivers reach on wet pavement while keeping steering control. Hard emergency braking on dry pavement is stronger.
The friction values are sliding values for locked wheels. With ABS the peak values, 0.8 to 0.9 on dry asphalt, apply.
Worn tires, standing water and loose surfaces give less friction than the table.
The results are estimates for one vehicle. They are not an accident reconstruction.
Worked example
A car travels at 60 mph on a level road. Using the AASHTO design values of 2.5 s and 3.4 m/s², how far does it travel before it stops?
Speed: 60 mph = 88 ft/s = 26.82 m/s.
Reaction distance: 88 × 2.5 = 220.0 ft.
Braking distance: 26.82² / (2 × 3.4) = 105.8 m = 347.1 ft.
Total stopping distance: 220.0 + 347.1 = 567.1 ft, or 172.9 m.
Time to stop: 2.5 + 26.82 / 3.4 = 10.39 s.
On a 5 % downgrade the braking distance grows to 405.6 ft. The AASHTO table, which rounds the deceleration to 11.2 ft/s², gives a design stopping sight distance of 570 ft at this speed.
The worked example, drawn by the same code as the live drawing above.
FAQ
How do I calculate stopping distance?
Add the reaction distance, speed × reaction time, to the braking distance, speed² / (2 × deceleration). Use consistent units, such as ft/s and ft/s².
What is the stopping distance at 60 mph?
About 567 ft with the AASHTO design values. A driver braking hard on dry asphalt with locked wheels needs 220 ft to react and 160 ft to brake.
What reaction time should I use?
AASHTO designs roads for 2.5 s, which covers nearly all drivers in a surprise situation. An alert driver who expects to brake reacts faster.
How much does speed affect stopping distance?
The braking distance grows with the square of speed. Going from 60 to 70 mph adds 36 % to the braking distance.
How much longer is stopping on a wet road?
With Wong's sliding values, braking on wet asphalt (0.45) takes 1.67 times as far as on dry asphalt (0.75).
Does a downhill slope increase stopping distance?
Yes. Gravity works against the brakes, so a 5 % downgrade cuts the effective deceleration by 0.49 m/s².
Before every release the calculator must reproduce each case below. The note under each case says where the expected answer comes from: a standard, a textbook, a published table, or a hand calculation shown in full.
AASHTO Table 3-1, 45 mph: brake reaction 165.4 ft, braking 194.4 ft, stopping sight distance 360 ft (2.5 s, 11.2 ft/s²)AASHTO Green Book Table 3-1 (level roadways), as reproduced by Iowa DOT; table uses 1.47 V t + 1.075 V² / a
AASHTO Table 3-1, 50 mph: calculated stopping sight distance about 423 ft (design 425 ft)AASHTO Green Book Table 3-1, 50 mph row
60 mph, 2.5 s, 3.4 m/s² on the level: 220.0 + 347.1 = 567.1 ft (172.9 m), 10.39 sHand calculation, d = v t + v² / (2a), v = 26.822 m/s
A 5 % downgrade lengthens braking to v² / (2 (3.4 − 0.49)) = 405.6 ft; a 5 % upgrade shortens itAASHTO braking distance on grades, d = V² / (30 (a/32.2 ± G)) in SI form
Wet asphalt (sliding μ 0.45, Wong) at 60 mph: braking 26.82² / (2 × 0.45 g) = 267.4 ft; ice μ 0.07 needs 1 719 ftWong, Theory of Ground Vehicles, 2nd ed., p. 26 (sliding coefficients); d = v² / (2 μ g)
A downgrade steeper than the friction, zero speed and an unknown surface are rejectedBehaviour check: warnings and rejected inputs
Worked example of the article: the calculator reproduces 220.0 ft, 347.1 ft, 567.1 ft, 172.9 m, 10.39 s to the digits printedThe worked example on this page, to the digits printed
Assumptions and sources
Assumptions and limits
Stopping distance is the distance travelled during the perception-reaction time at constant speed plus the braking distance at a constant deceleration: d = v t + v² / (2 (a + g G)).
AASHTO design values: a perception-reaction time of 2.5 s, which covers most drivers including older ones in surprise situations, and a deceleration of 3.4 m/s² (11.2 ft/s²), which most drivers can achieve on wet pavement while keeping control (Green Book, Section 3.2.2).
Friction values are Wong’s average sliding (locked-wheel) coefficients; with ABS and good tires the peak coefficient (0.8 to 0.9 on dry asphalt) can be used, while worn tires and standing water give less.
The grade G is positive uphill and negative downhill, as a decimal of the rise over the run; the term g G is the small-angle form AASHTO uses.
The calculation ignores brake response and pressure build-up beyond the reaction time, aerodynamic drag and load transfer; it is a single-vehicle estimate, not an accident reconstruction.
Sources
AASHTO, A Policy on Geometric Design of Highways and Streets (Green Book), 7th ed. 2018, Section 3.2.2 Stopping sight distance, Table 3-1 (level roadways) and the braking distance on grades
J.Y. Wong, Theory of Ground Vehicles, 2nd ed., Wiley 1993, p. 26: average values of coefficient of road adhesion (peak and sliding)
Cite this calculator
Papandreou, C. (2026). Stopping distance calculator. Engineering Bible. https://engineeringbible.com/automotive/stopping-distance/
Embed this calculator on your site
Copy this HTML into your page. The calculator stays free to use and links back here.